Optical Modeling of UV Sterilization Systems
Current worldwide conditions have brought a renewed focus on ultraviolet or UV based sterilization systems. UV light has been shown to kill many types of pathogens. A key metric is the dose, or amount of UV light on a surface, as a minimum dosage level is required for effective sterilization. Using optical analysis software as part of the design process ensures that these minimum dosage levels are obtained.
By designing and modeling the system in software, or virtual environment, the design process is faster and more efficient. The first step in the process is the same as many optical design projects, and that is to ask what is the goal? How much light is needed on a surface? In most cases for UV sterilization system this will be defined by a dose requirement in watts or joules per unit area. Examples could be W/m2 or µJ/cm2. Since the dose requirement will also have a time factor, that will also need to be taken into account. For example, if the required dose is 5 J/cm2 and the “on” time for the light is to be 10-seconds, then the required irradiance would be 0.5 W/cm2. Using these values and the surface area of the device or object to be disinfected, it is possible to calculate the total optical power required.
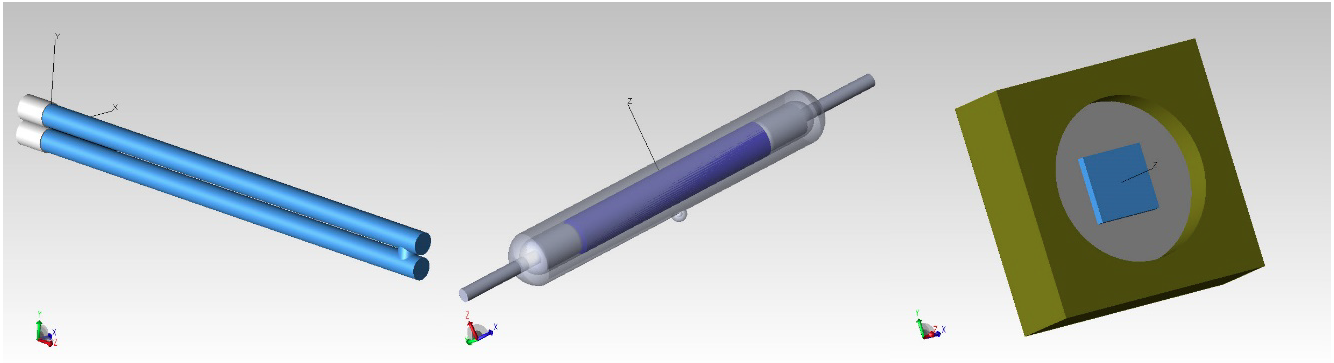
The next step is to select the appropriate light source. There are many options for UV light sources, including LEDs, mercury lamps, xenon lamps, etc. The UV range of the spectrum in air extends from around 185nm to 400nm. Below 185nm the UV light is absorbed by the air. In a vacuum the UV spectrum can extend lower. The UV spectrum is divided into 3 bands, UVC (100-280nm), UVB (280- 315nm), and UVA (315-400nm). Many germicidal or sterilization systems will use the UVC spectral band. Figure 1 shows some examples of different UV source models.
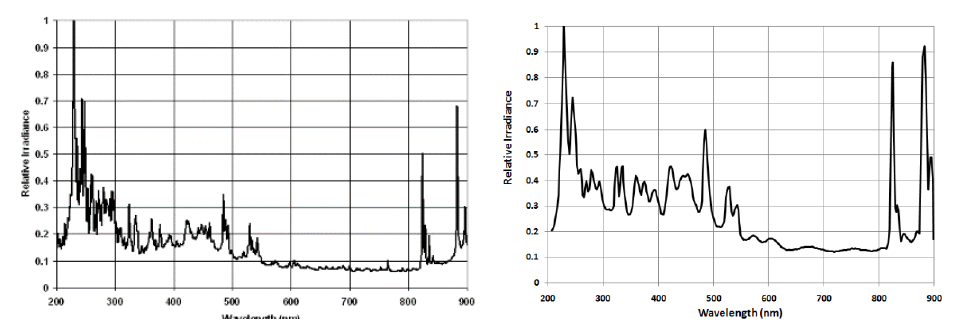
When modeling the light source in optical analysis software, it is important to make sure the spectral and angular distribution of the modeled sources matches the actual source. Figure 2 below shows the measured and modeled spectrums for a xenon flashlamp.
Selecting materials and surfaces for the system is also a critical aspect of the process. Many materials or surfaces finishes that work well as reflectors and diffusers in the visible light region will absorb UV light. This eliminates many plastics from consideration as well as many common optical glasses. If the design requires transmissive elements such as windows or enclosures, then many times quartz or UV transmitting glass is needed. The same is also true of materials or surface finishes used as reflectors. Many of the reflector materials used in luminaire design will not reflect UV wavelengths. PTFE type materials are often used when a diffuse reflector is required. Diffuse reflectors can allow for additional degrees of freedom in the design as well as potential challenges as they make the light more difficult to control.
The actual design of the system can be done either in CAD software or in some cases, directly in the optical analysis software. If a CAD program is used for the design, many optical analysis programs will allow for the import of CAD files such as SAT, STEP, and IGES files.
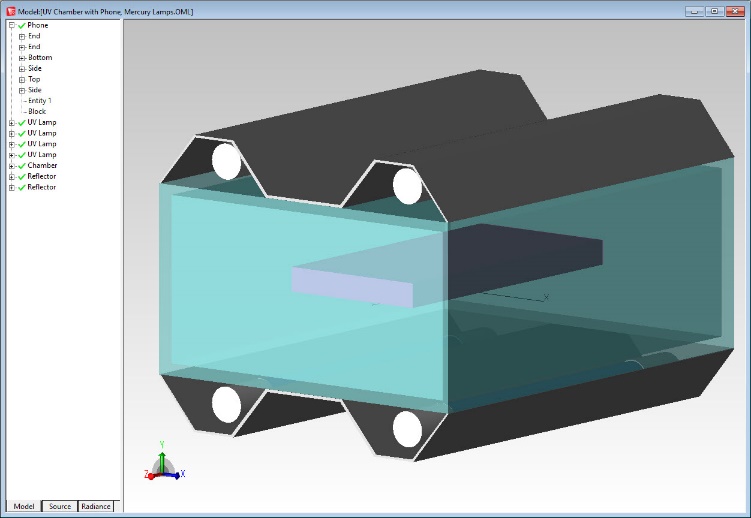
Let’s look at a couple of examples to show how the tools available in optical design and analysis software can help with the development process. The first example will use four mercury germicidal lamps surrounding a quartz enclosure with a cellphone sized object in the chamber. There are specular reflectors behind the mercury lamps and the walls of the quartz chamber have a diffuse white reflective material applied. Figure 3 shows the system model with the lamps and a cellphone sized object.
The Irradiance Map in Figure 4 shows the distribution of light on the top surface of the cellphone as well as the resulting irradiance values in W/m2. The horizontal and vertical irradiance profiles are also shown.
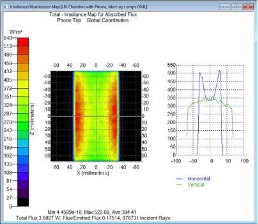
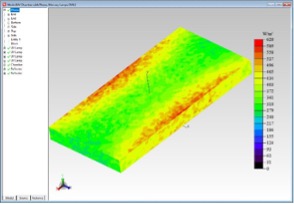
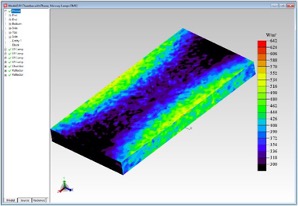
Figure 5 shows the 3D Irradiance Map for the cellphone object. A nice feature of the 3D Irradiance Map is that is allows the user to see the irradiance distributions on all surfaces of the object, both flat and curved. Another useful feature of the Irradiance and 3D Irradiance Maps is the ability to set minimum and maximum levels. This can be used to show all areas of the object where the irradiance is above some minimum level. For example, Figure 6 shows the areas where the irradiance is above 300 W/m2.
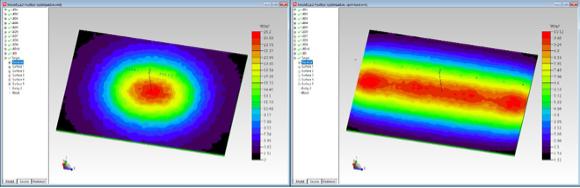
Another powerful capability in some optical design and analysis software is the ability to automatically optimize a design to a user defined set of criteria, such as flux or irradiance values, uniformity, irradiance profile, and many other options. This capability allows the user to automatically test a large number of variations of a design in a fast and efficient manner. In the example below the goal is to produce a uniform distribution of light along the length of the target surface. The position of the 11 LEDs will be optimized to provide the best uniformity along this long axis.
In this example the optimization process was quick, with over 230 iterations tested in well under an hour. The driving factor in the optimization is the raytrace time. The user needs to make sure to trace enough rays to get an accurate and meaningful answer. The optimization process could also be easily extended along the short axis to add more LEDs and produce even illumination across the whole surface. Figure 7 shows the irradiance distribution before and after the optimization process.
Modern day optical design and analysis software is a great tool when it comes to designing and optimizing UV based sterilization systems. The ability to model and test multiple variations of a design in a short period of time can speed the development process as well as reduce the cost of the development, especially in terms of limiting the number of physical prototypes that may need to produced. Designing and modeling UV based systems brings its own unique set of challenges though. Materials and surface finishes need to be chosen carefully to ensure that those materials and surfaces will reflect and transmit in the UV spectral band. Another concern that should be considered is that some materials and surfaces may have their UV transmission and reflectivity diminished due to extended UV exposure. As in all optical modeling, accurate source modeling and tracing enough rays is also an important factor.
About Lambda Research Corporation
Lambda Research Corporation sets itself apart as a cost-effective, single-source solution for optical and illumination design. Lambda sells TracePro® opto-mechanical software known for its ease of use, CAD interface and accuracy in illumination design, OSLO® optical design software renowned for its power and flexibility in lens design, and RayViz™, a ray-tracing add-in for SOLIDWORKS.